Bitcoin reclaims $80,000, eyes $85,000 amid short-term risk

Bitcoin closed above $80,000 for the first time since Jan. 31 and targets $85,000, while 4‑hour indicators are overbought and trading volume declined during the recent rally.
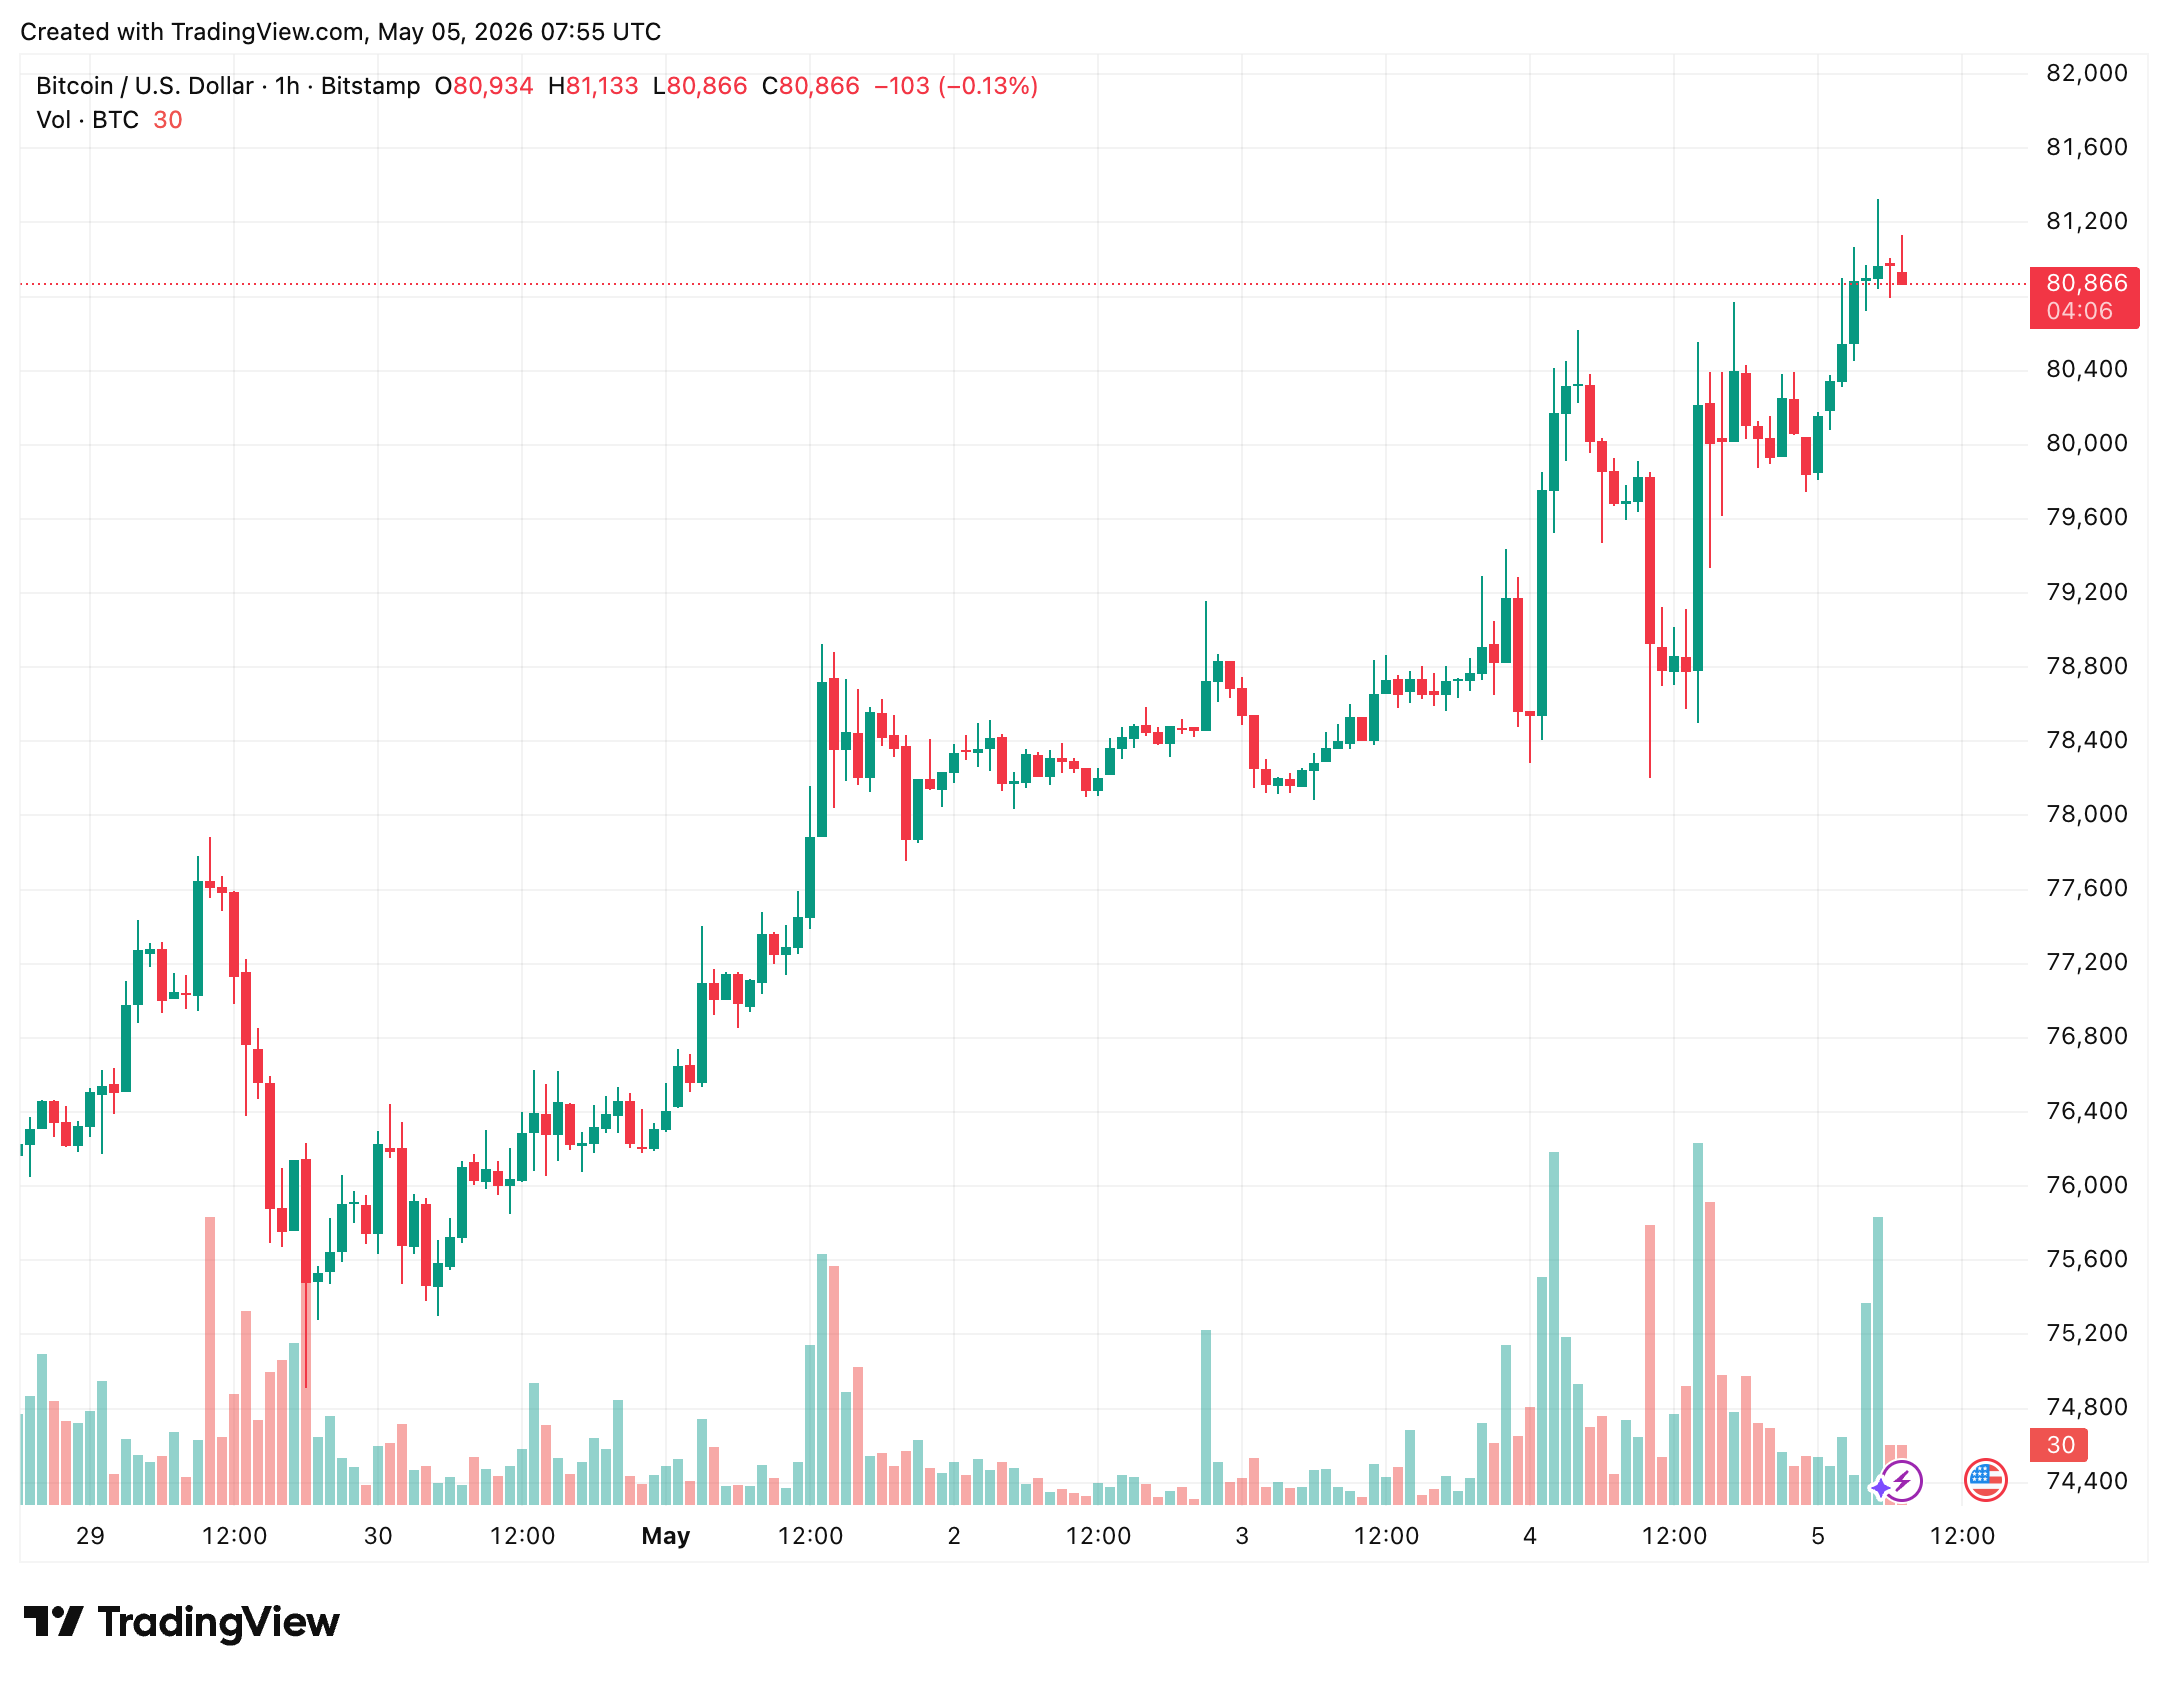
Bitcoin closed above $80,000 on the daily chart for the first time since Jan. 31, flipping the level back into support and directing attention to the next resistance near $85,000. The price break also cleared a descending trendline drawn from the April 13 swing high.
The token bounced from roughly $75,000, a zone that acted as resistance in February and March, and found support near the 20-day moving average as it pushed higher. On the daily chart the Relative Strength Index has moved up toward overbought readings without showing bearish divergence, and the MACD registered a bullish crossover.
Immediate upside interest centers on the 0.382 Fibonacci retracement around $85,000. A clean break above that level would open a path toward the 0.618 retracement near $100,900.
Analyst Michael van de Poppe pointed to ongoing institutional demand and continued spot-BTC ETF inflows, citing about $600 million of inflows on the first trading day of May after strong inflows in April. He described recent consolidation as shallow, noted that buyers have been quick to absorb dips, and listed $86,000–$88,000 as a near resistance area and $92,000–$94,000 as a higher target.
Lower-timeframe indicators show a different picture. On the 4‑hour chart the RSI is in overbought territory and MACD momentum bars remain positive, while trading volume declined during the most recent leg up. Since March 26, BTC largely traded inside a parallel ascending channel and broke below the channel’s lower band on April 27; current price action resembles a retest of that broken channel from underneath.
If the lower band holds as resistance, price could move back toward the $75,000 area, where the 0.236 Fibonacci retracement and a rising 50-day moving average would be the next support tests. A failure of that zone would remove a key part of the bullish technical case and could mirror earlier pullbacks that followed slower ETF flows.
Market participants are watching technical levels and ETF inflows over the next 24 to 48 hours for signs the breakout will extend or give way to a corrective leg.
Articles by this author